Drowning in Garbage
A WORLD OF WASTE
Rapid economic development and population growth, along with urbanisation, has increased the number of consumer goods, along with the amount of waste generated, which is harmful to our health and the planet, especially when not packaged in an environmentally safe manner. Unless urgent action is taken to save, reuse and recycle, global waste will “increase by 70% over the next 30 years”, warns the World Bank. In 2050, global waste generation is expected “to jump to 3.4 billion tonnes”, up 70% from the 2.01 billion tonnes generated in 2016, of which 33 % aren’t generated sustainably, reveals the most recent report published by the World Bank: “What a Waste 2.0: A Global Snapshot of Solid Waste Management to 2050”.
A SEA OF PLASTIC
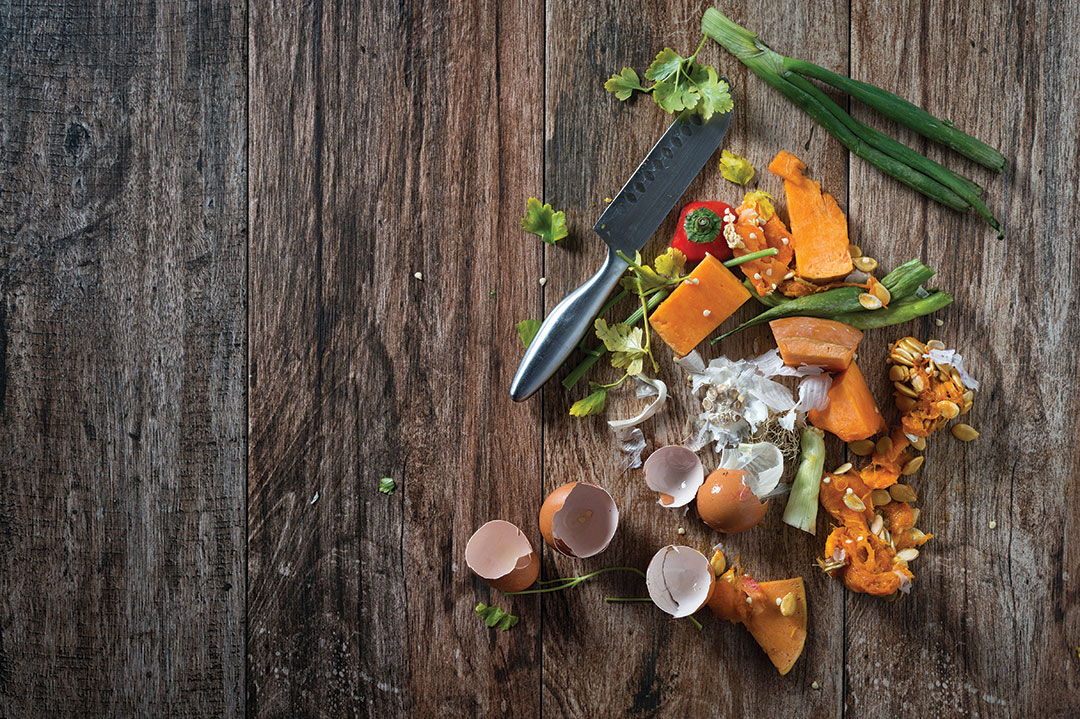
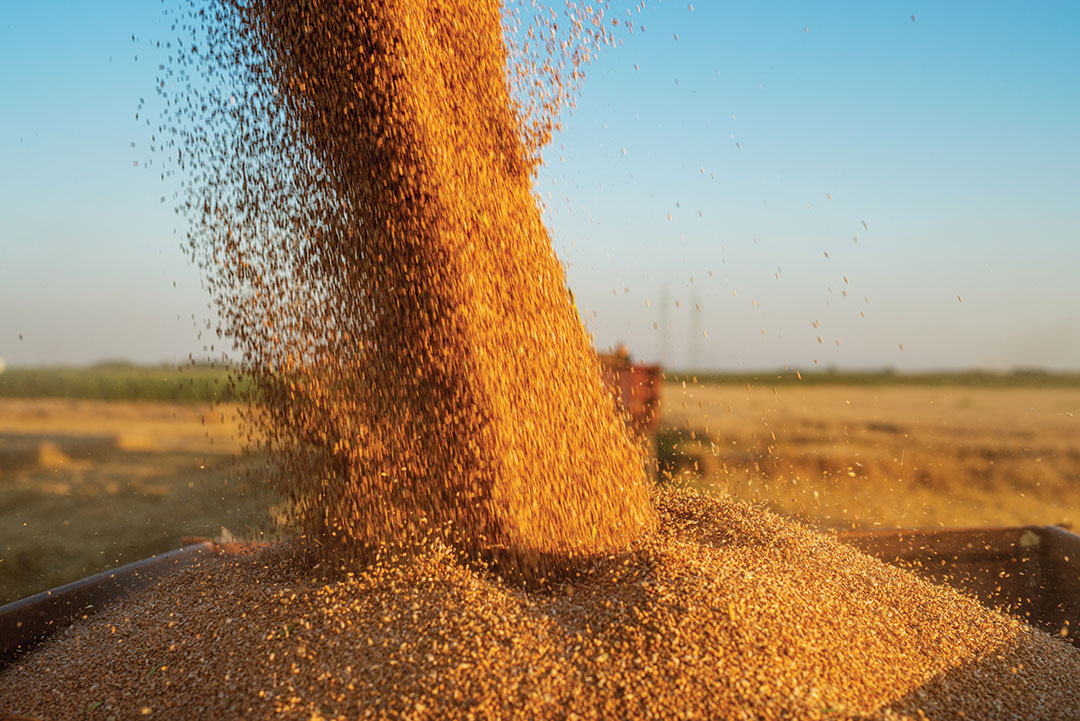
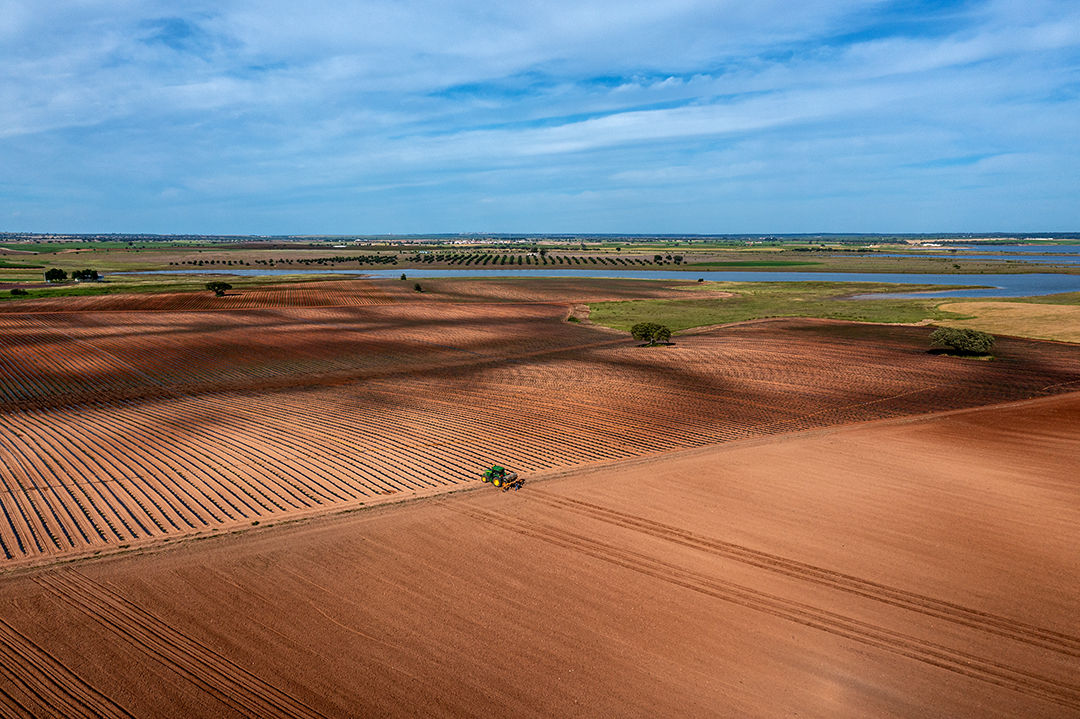
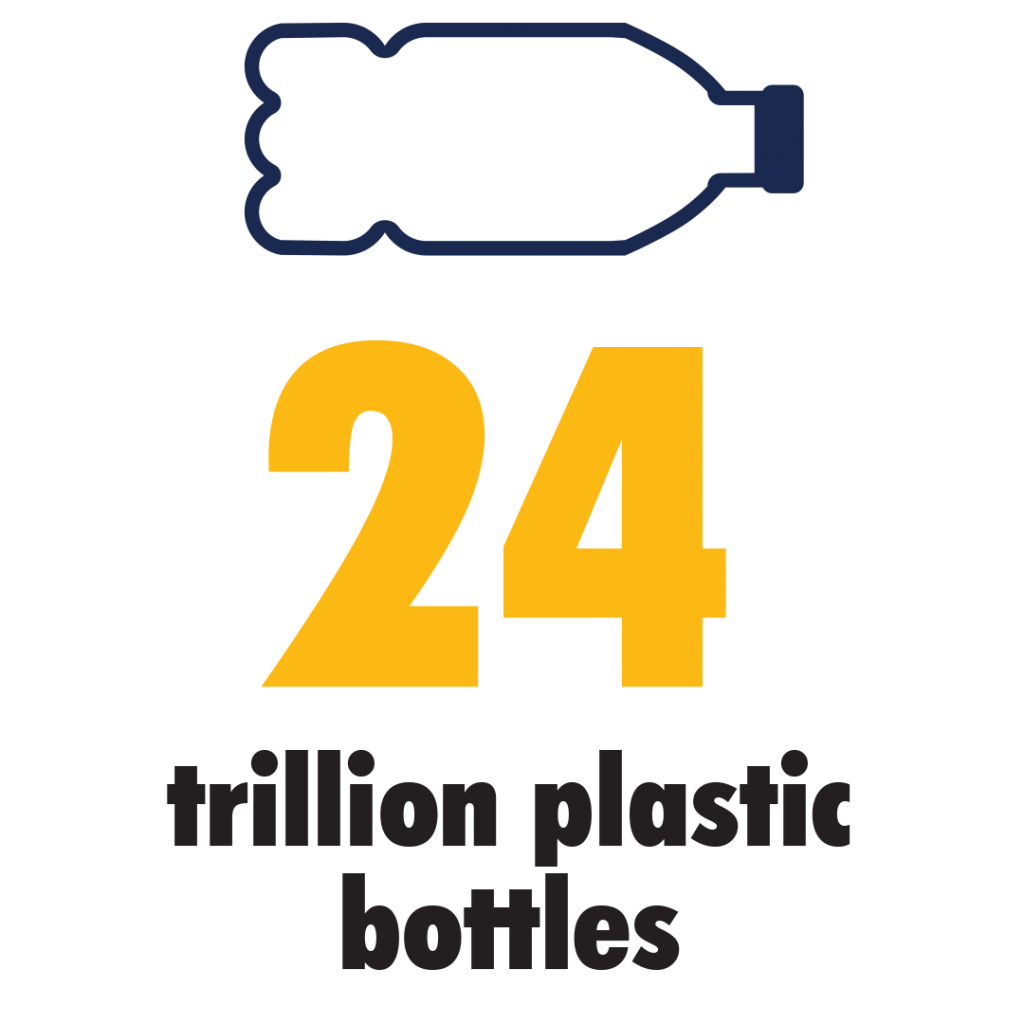
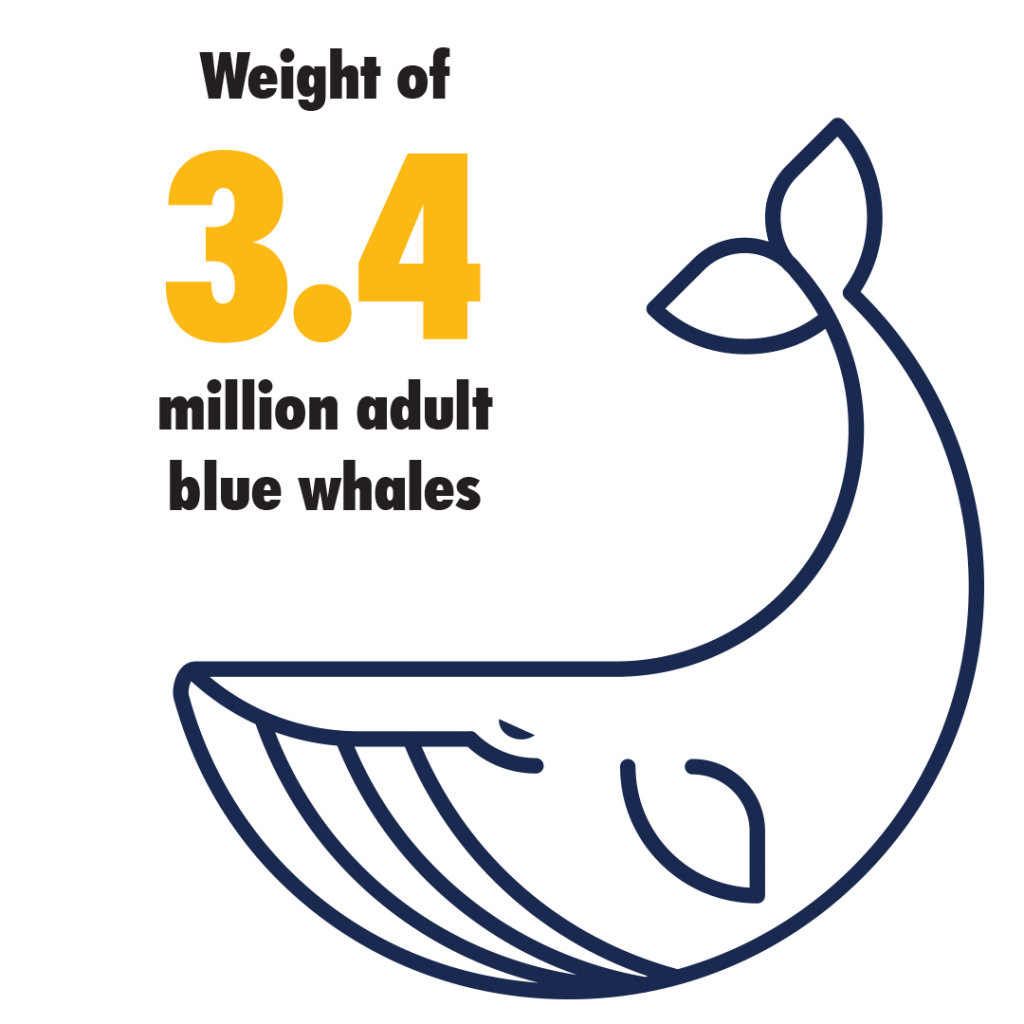
Most (44%) of the world’s waste is generated from food and agricultural waste. However, plastic, which accounts for only 12% of global waste, is one of the most dangerous types of waste and threatens to contaminate water resources that are vital for life on Earth. In 2016, 242 million tonnes of plastic waste were generated, which is equivalent to approximately 24 trillion 500 ml 10 gr plastic bottles. These could fill up 2,400 Olympic stadiums, 4.8 million Olympic-size swimming pools or 40 billion bathtubs. It is also equivalent to the weight of 3.4 million adult blue whales or 1,376 Empire State Buildings combined.
Higher-income countries produce the most plastic waste and they’re also responsible for generating a large portion of the world’s waste, despite representing only 16% of the world’s population. Each year, these counties generate one-third (34%) of global waste: 32% organic waste, 25% paper and cardboard and 13% plastic waste.

There is a direct proportional link between the rate of a country’s development and the amount of waste it generates. But these are also the regions that reuse and recycle waste more, because they have the knowledge, technology and financial resources to do so, unlike lower-income countries.
WHO WASTES MORE?
However, if we analyse waste distribution per continent, East Asia and the Pacific Region top the list of regions that generate the most waste, accounting for one-fourth (23%) of the world’s waste: 468 million tonnes. The second biggest producers of waste are Europe and Central Asia, which account for 392 million tonnes of waste per year. As underdeveloped areas experience economic development, the World Bank estimates that, in 2050, waste production in Sub-Saharan Africa will triple, while South Asia is expected to double waste generation.
IN 2016, THE WORLD GENERATED, 242 MILLION TONNES OF PLASTIC WASTE
THAT’S EQUIVALENT TO:
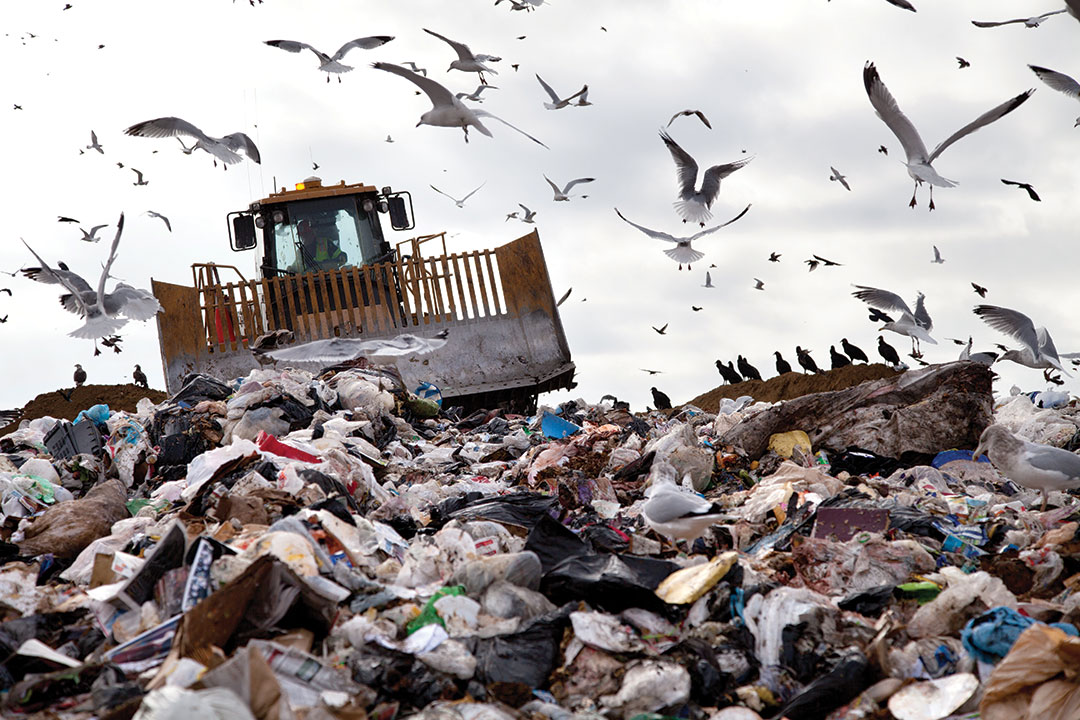
40% OF WASTE IS DUMPED IN LANDFILLS
All over the world, nearly 40% of waste is dumped in landfills, with only 4% deposited in controlled areas. Approximately 19% is recovered through recycling (13.5%) and composting (5.5%) and 11% of global waste is incinerated. However, open dumping still accounts for 33% of waste. This type of waste disposal is more common in underdeveloped regions like Sub-Saharan Africa and South Asia, while recycling, composting and sanitary landfills are starting to be used on higher-income continents like Europe and Central Asia and North America.
DID YOU KNOW?
1. We each produce an average of 0.74 kg of waste per day;
2. Organic waste accounts for more than 50% of waste generated in low-income or developing countries, while higher-income countries generate only 32%;
3. In low-income countries, only 16% of paper, cardboard, plastic, metal and glass is recycled, while developed regions recycle 50%.
Source: World Bank, “What a Waste 2.0: A Global Snapshot of Solid Waste Management to 2050”